Staring at wild price swings in your favorite cryptocurrency can feel overwhelming and confusing. One minute you’re up big, the next you’re watching gains evaporate while wondering what those lines and bars actually mean. Many beginners lose money simply because they jump in without understanding how to read crypto charts effectively. In 2026, with more sophisticated tools and market participants, mastering basic chart analysis gives you a real edge. This guide walks you through the essentials so you can make informed decisions instead of emotional guesses. Let’s turn those intimidating screens into actionable insights.
Understanding Candlestick Charts—The Foundation
Candlestick charts show price action over specific timeframes using colorful bars that reveal open, high, low, and close values. Green or white candles indicate closing prices higher than opening, signaling upward momentum. Red or black ones show the opposite—closing lower than opening.
Long wicks or shadows on candles reveal rejection of certain price levels. A long upper wick suggests sellers pushed prices down after buyers tried driving them higher. Study patterns over multiple timeframes to confirm trends before acting.
A friend who started trading last year lost early on by ignoring candle formations. Once he learned to spot doji candles indicating indecision, his timing improved dramatically.
Key Technical Indicators Every Beginner Should Know
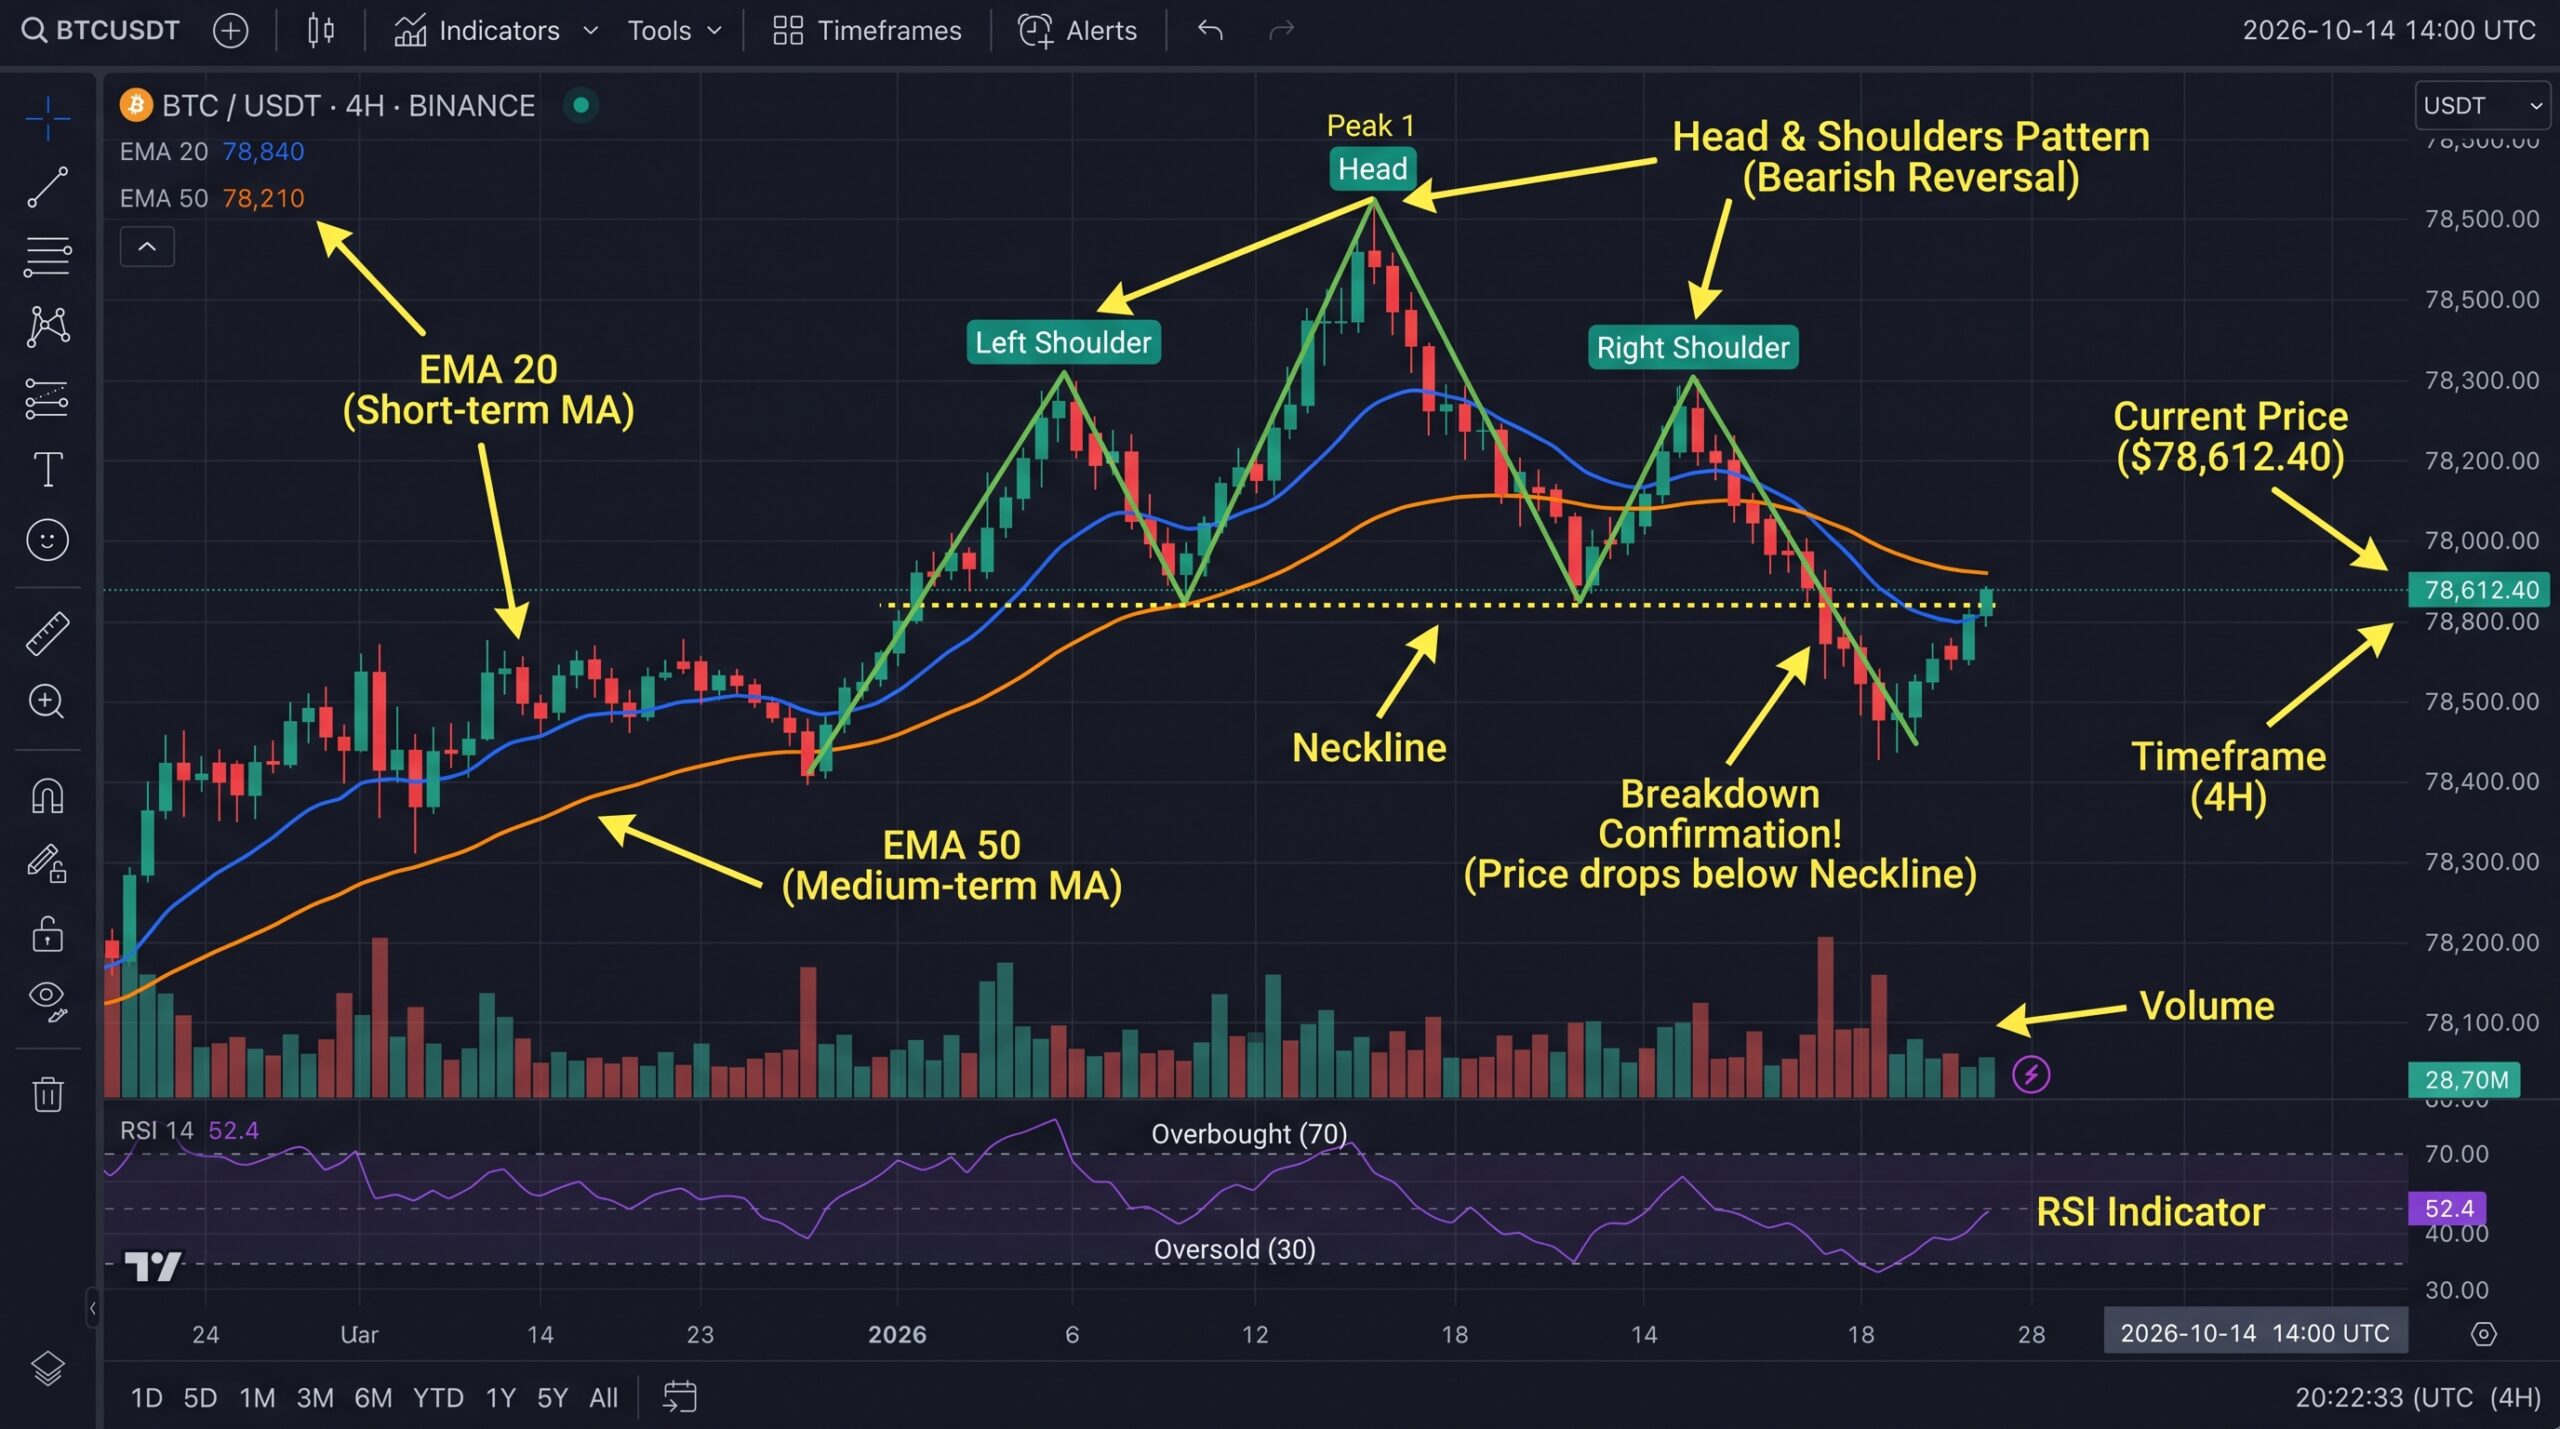
Moving averages smooth price data to identify trends more clearly. The 50-day and 200-day versions often act as dynamic support or resistance. Crossovers between them generate buy or sell signals many traders watch closely.
Relative Strength Index (RSI) measures momentum on a 0-100 scale. Readings above 70 suggest overbought conditions ripe for pullbacks, while below 30 indicate oversold opportunities. Combine RSI with volume analysis for stronger confirmation.
Volume bars at the bottom of charts show participation strength. Rising prices on increasing volume confirm genuine buying interest rather than low-conviction moves.
Chart Patterns That Signal Potential Moves
Head and shoulders formations often predict trend reversals when completed. Double bottoms after downtrends frequently mark buying opportunities as support holds twice. Triangles and flags indicate consolidation before continuation of the prior trend.
Fibonacci retracement levels help identify potential support during pullbacks within larger uptrends. The 38.2%, 50%, and 61.8% lines appear frequently as areas where price respects historical ratios.
Practice spotting these patterns on historical charts before risking real capital. Paper trading builds confidence without financial consequences.
Risk Management and Practical Trading Tips
Never risk more than 1-2% of your portfolio on any single trade regardless of conviction. Set stop-loss orders based on technical levels rather than arbitrary percentages. Take partial profits at predetermined targets to lock in gains while letting winners run.
Combine technical analysis with fundamental research about projects, adoption metrics, and regulatory news. Avoid FOMO-driven decisions during parabolic moves—those often precede sharp corrections.
Maintain a trading journal documenting your rationale, entry/exit points, and lessons learned. Reviewing past trades accelerates improvement faster than any indicator alone.
Start applying these concepts today. Open a demo account on a reputable exchange, practice reading live charts for a few weeks, and gradually transition to small real positions. Focus on consistency over quick riches. The cryptocurrency market rewards prepared traders who respect risk and continually learn. Your future portfolio will reflect the effort you invest now.
FAQ
What timeframe should beginners focus on first?
Daily and 4-hour charts provide clearer trends than noisy 1-minute or 5-minute ones for new traders.
Do I need paid charting tools?
Free platforms like TradingView offer powerful features sufficient for most beginners.
How reliable are chart patterns really?
They work best when combined with volume, fundamentals, and proper risk management rather than in isolation.
Should I use multiple indicators simultaneously?
Start simple with price action and one or two indicators, adding complexity only after mastering basics.
How long does it take to get good at reading charts?
Consistent practice over several months builds solid skills—there are no true shortcuts in technical analysis.