
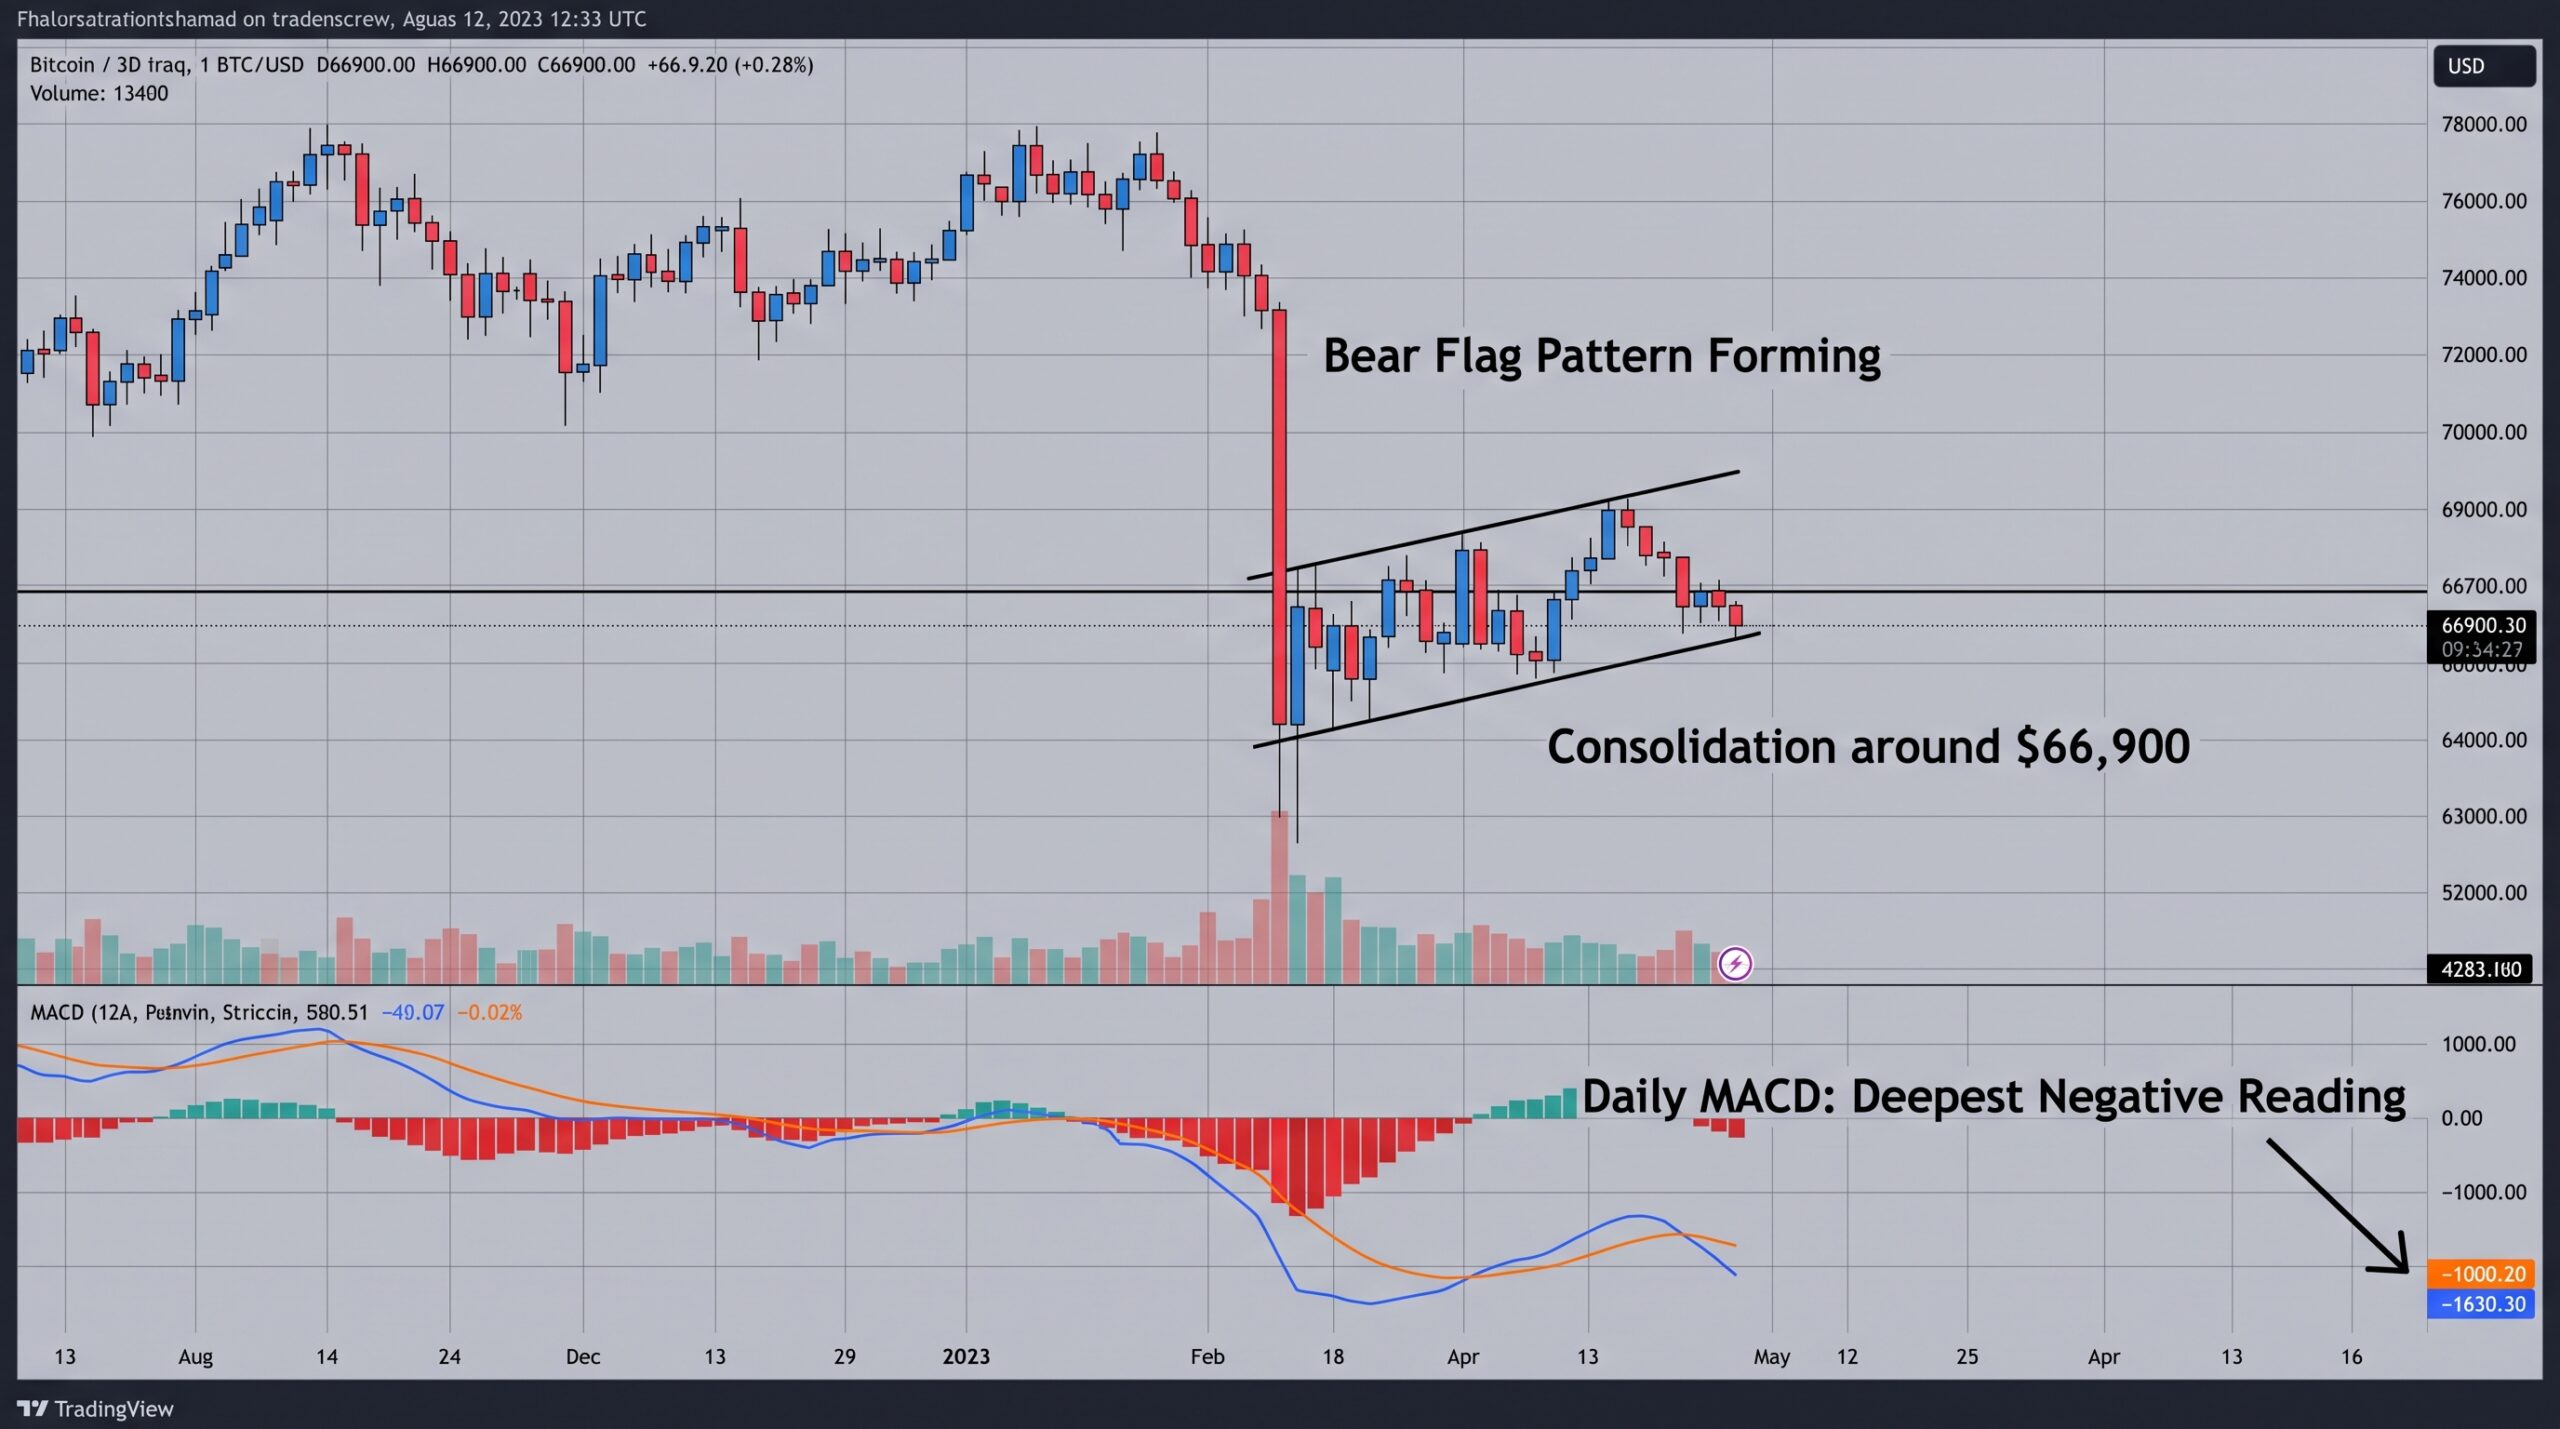
You see Bitcoin consolidate after a sharp drop and wonder whether the pause is healthy digestion or the calm before another leg lower. When price hovers near $66,900 and the daily MACD histogram prints one of its most negative readings in months, that question becomes urgent.
Technicians have flagged a potential bear-flag structure in this region. A bear flag is a continuation pattern: a sharp decline (the pole) followed by a tighter, often upward-sloping consolidation (the flag). A breakdown from the flag frequently leads to another move of similar magnitude to the pole. Pair that pattern with an extremely negative MACD and the caution level rises.
Understanding the Bear-Flag Setup Near $66,900
In the period when Bitcoin traded around $66,900 after falling from higher levels, the 4-hour and daily charts showed a compact ascending or sideways channel forming inside the larger downtrend. That shape matches the classic bear-flag description.
The lower boundary of the flag and nearby broken support zones (often cited near $66,200–$65,500) become critical. A decisive close below those levels, especially on rising volume, would confirm the pattern for many chartists and open measured-move targets further down. Until that breakdown occurs, the structure remains only a potential flag rather than a completed signal.
I have watched similar consolidations resolve both ways. The pattern works best when the prior downtrend is clear and momentum remains weak—precisely the conditions a deeply negative MACD helps confirm.
What the Deeply Negative Daily MACD Adds
The MACD histogram reaching one of its lowest readings in months signals strong bearish momentum on the daily timeframe. When the MACD line sits well below its signal line and the histogram is deeply negative, it shows that the short-term moving average remains under sustained pressure relative to the longer one.
Extremely negative MACD readings do not guarantee immediate further declines. They do indicate that any rebound faces an uphill battle against prevailing momentum. In past cycles, shallow recoveries inside a bearish MACD regime often failed, leading to another leg lower once the relief bounce exhausted itself.
Traders use the indicator as a trend filter rather than a precise timing tool. A deeply negative reading raises the bar for bullish confirmation and keeps the benefit of the doubt with the bears until the histogram begins to contract meaningfully and a bullish crossover appears.
Key Levels That Decide the Next Move
On the downside, a confirmed break below the flag’s lower boundary and the nearby Supertrend or support cluster (frequently referenced around $65,500) would strengthen the bearish case. Measured-move projections from a completed bear flag often pointed toward the low $60,000s or deeper, depending on the height of the preceding pole.
On the upside, a daily close back above the flag’s upper boundary and the $68,400–$70,000 zone would be the first serious challenge to the bearish structure. That kind of reclaim, especially if accompanied by improving MACD momentum, would suggest the consolidation was corrective rather than a continuation pattern.
Volume and broader market context matter. Low-volume drifts inside the flag carry less information than high-volume breaks in either direction.
How Traders Can Approach the Setup
Respect the pattern without treating it as destiny. Bear flags fail regularly, especially when higher-timeframe trend or on-chain demand shifts. Risk management remains the priority: define invalidation levels clearly and size positions so that a false breakdown or unexpected squeeze does not become damaging.
Short-term traders may look for breakdown entries with tight risk above the flag, while longer-term participants often wait for clearer trend confirmation or a successful retest of broken levels. In both cases the deeply negative MACD argues against aggressive dip-buying until momentum shows signs of stabilization.
FAQ
What is a bear flag?
A continuation pattern that forms after a sharp decline. Price consolidates in a tight range or mild uptrend before potentially breaking lower.
Does a deeply negative MACD guarantee more downside?
No. It reflects strong bearish momentum and makes sustained rallies harder, but markets can stabilize and reverse even from extreme readings.
What would invalidate the bear-flag thesis?
A strong daily close above the flag’s upper boundary and key resistance (often cited near $68,400–$70,000) together with improving momentum.
How reliable are bear flags on Bitcoin?
They appear frequently in downtrends and have a reasonable success rate when confirmed by volume and momentum, yet they are not infallible.
Should I short every potential bear flag?
Only with clear risk parameters. Many consolidations resolve higher, especially if the broader market sentiment improves.
What other indicators should I watch alongside MACD?
Volume on the break, higher-timeframe trend structure, and key moving averages or Supertrend levels for confluence.
Leave a Reply