
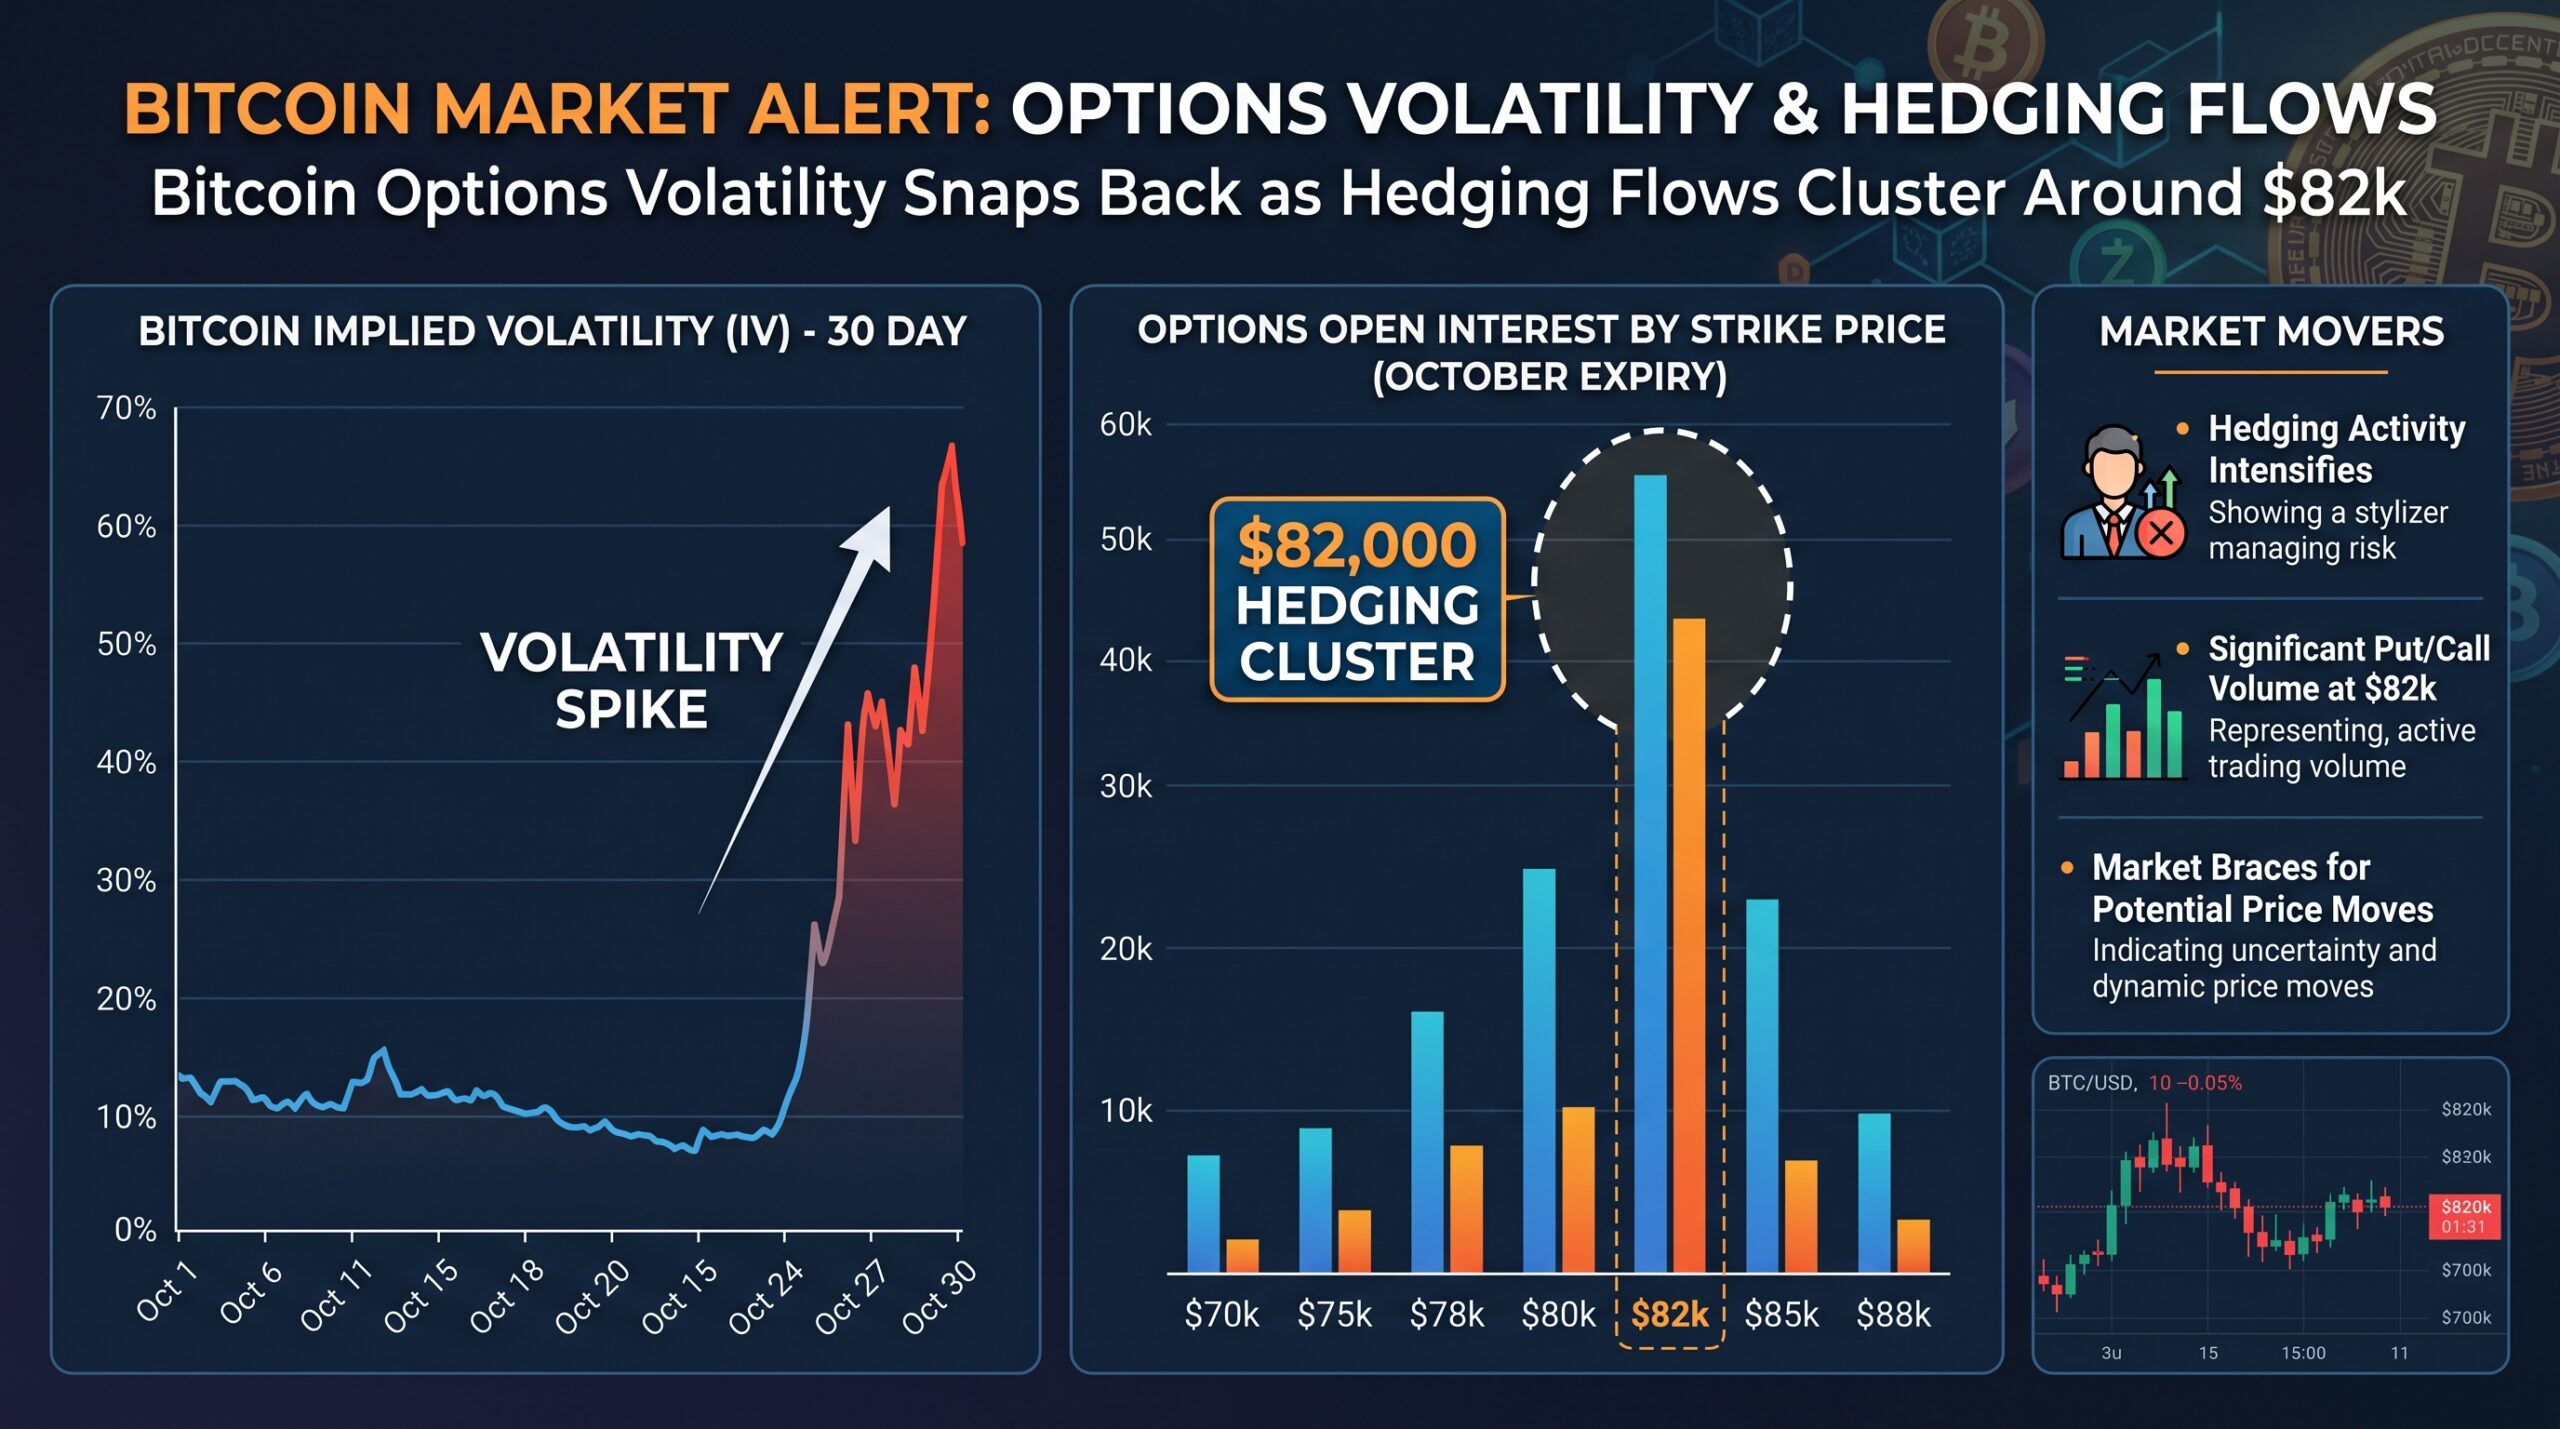
You watch Bitcoin grind higher and assume the options market will stay quiet. Then price pushes into the low $80,000s and short-dated implied volatility suddenly wakes up. That is exactly what happened when BTC entered the $82,000–$83,000 zone.
Glassnode and other derivatives trackers flagged a sharp rebound in front-end volatility together with a large pocket of short-gamma exposure centered near $82,000. Dealer hedging around that strike can turn modest price moves into larger swings. Understanding the setup helps you read the next few sessions with clearer eyes.
Why Short-Dated Volatility Repriced Higher
After an extended period of compressed realized volatility, one-week implied volatility climbed roughly six volatility points from its late-2025 lows once Bitcoin cleared key resistance. The move signaled fresh demand for short-term optionality rather than a broad panic.
Longer-dated volatility rose far less, showing the repricing was concentrated in the front end. At the same time the 25-delta skew compressed toward neutral. Put-heavy hedging demand eased, and the volatility risk premium flipped positive—meaning options began pricing more future movement than the spot market had recently delivered.
I have seen this pattern before. When spot breaks a well-watched level after a quiet stretch, short-term options often reprice first while the rest of the curve lags.
The $2 Billion Short-Gamma Cluster at $82k
The most important mechanical detail sits in the gamma profile. Roughly $2 billion of short-gamma exposure clustered around the $82,000 strike. When dealers are short gamma they must buy into strength and sell into weakness to stay delta-neutral.
That hedging flow can amplify whatever direction price takes once it enters the zone. A modest rally can force additional buying; a pullback can force additional selling. The result is larger realized swings than the underlying order flow alone would produce. Traders sometimes call these areas “gamma walls” or “volatility magnets” for good reason.
What Recent Options Flow Revealed
In the sessions around the $82k–$83k push, call selling dominated—accounting for roughly 81% of observed flow in one 24-hour window. That pattern usually reflects profit-taking and overwriting rather than aggressive new downside bets.
Combined with the neutral-to-compressing skew, the flow suggested many participants expected consolidation or limited upside follow-through in the very near term. Positioning did not scream panic. It pointed to a market that had just woken up and was still deciding how far the next move might travel.
How Traders Can Use This Information
Watch the $80,000–$82,000 band closely. As long as price remains inside or near the short-gamma pocket, expect choppier two-way action and wider intraday ranges. A clean break higher that forces dealers to chase could extend the move; a rejection that triggers selling could accelerate the downside.
Short-dated options became more expensive after the snap-back, so buying volatility outright carries a higher premium. Selling premium or structuring defined-risk spreads may suit traders who expect the range to persist. Always size positions for the possibility that hedging flows exaggerate the next swing.
Keep an eye on changes in open interest and skew. A rapid buildup of new puts or a sharp steepening of skew would signal a different regime than the one observed during the initial rebound.
FAQ
What does “short gamma” mean for price action?
Dealers short gamma hedge by buying as price rises and selling as price falls, which can magnify moves around the strike.
Why did one-week IV rise while longer-dated IV stayed quieter?
The market repriced near-term uncertainty after the breakout; longer-term expectations changed more slowly.
Is the $82k level still important after the initial move?
Gamma profiles shift with new positioning and expiries. The level mattered most while the large short-gamma pocket remained concentrated there.
Did the skew show fear?
No. Compression toward neutral suggested reduced demand for downside protection rather than rising fear.
Should I buy options because IV snapped higher?
Higher IV means options cost more. Any long-volatility trade needs a large enough subsequent move to overcome the richer premium.
How often do these gamma clusters appear?
They form regularly around round numbers and high-open-interest strikes. Their impact is greatest when open interest is large relative to typical daily volume.
Leave a Reply